
Download RadarNow! for Android on Google Play
The colors are the different echo intensities (reflectivity) measured in dBZ (decibels of Z) during each elevation scan. “Reflectivity” is the amount of transmitted power returned to the radar receiver. Reflectivity (designated by the letter Z) covers a wide range of signals (from very weak to very strong). So, a more convenient number for calculations and comparison, a decibel (or logarithmic) scale (dBZ), is used.
The dBZ values increase as the strength of the signal returned to the radar increases.
The scale of dBZ values is also related to the intensity of rainfall. Typically, light rain is occurring when the dBZ value reaches 20. The higher the dBZ, the stronger the rainrate. Depending on the type of weather occurring and the area of the U.S., forecasters use a set of rainrates which are associated to the dBZ values.
These values are estimates of the rainfall per hour, updated each volume scan, with rainfall accumulated over time. Hail is a good reflector of energy and will return very high dBZ values. Since hail can cause the rainfall estimates to be higher than what is actually occurring, steps are taken to prevent these high dBZ values from being converted to rainfall.
Velocity modes
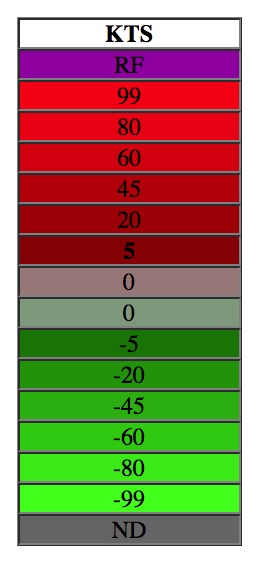
What do the colors mean in the velocity images?
The colors are the different radial velocities measured by the radar. In velocity images, red colors indicated wind moving away from the radar with green colors indicating motion toward the radar. The transition zone between incoming and outgoing winds are indicated the gray-ish colors between the two.
Each velocity image includes one of two velocity scales regardless of the radar’s operation mode. One scale (far left) represents radial velocities in the base velocity image. The other scale (near left) represents the “storm relative motion” radial velocities. Note: As in the case of reflectivity images, the color on each scale remains the same in both velocity images, only the values change. The velocity of the wind is measured in knots (1 knot = 1.15 mph).
Since these colors represent values relative to the radar, to interpret these images correctly, it is most important to know where the radar is located each velocity image. For example, a region with outbound wind in one radar will be represented by red colors. That same region’s wind could be inbound on an adjacent radar image and represented by green colors.
Download RadarNow! for Android on Google Play
For any questions or concerns about RadarNow!, please use the “Contact us” form inside of RadarNow! (off the left navigation menu) to request support. We answer all support requests within three days and often, within ten minutes. Thanks!
